Macro, Meso and Microclimates
The first viticulture book I read was written by an Australian named John Gladstone, Viticulture and Environment. It goes into depth defining climate, what influences climate, climatic indices and their relative effect on viticulture. The book also compares climates from wine growing regions from around the world. He does a fantastic job of defining climate by spatial scale.
Why does this matter? In any given vintage there is talk about the macroclimate but the day-to-day considerations and efforts to farm the best quality fruit deal with the meso and microclimates. The meso and microclimates dictate how each site is farmed, taking into consideration the climactic characteristics that make each site unique.
There are three spatial scales that are generally recognized: Macro, Meso and Mircroclimates.
Macroclimate
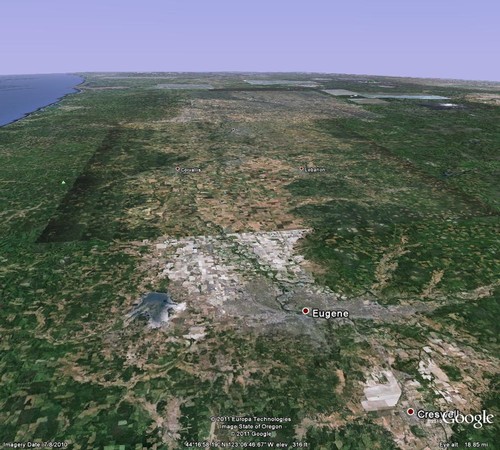
The macroclimate broadly defines the climate of a region. Most of the time this describes the general climate pattern from a recording station. Its scale is from tens of miles to hundreds of miles. Examples of macro climates are the Willamette Valley (figure 1), the Rogue Valley and Eastern Oregon.
Figure 1.
Mesoclimate
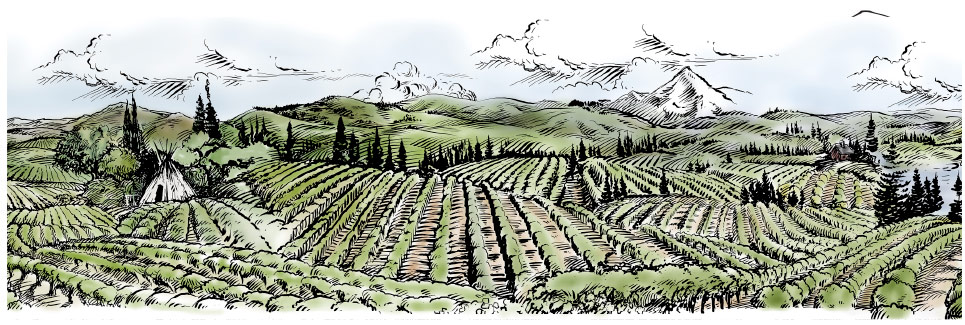
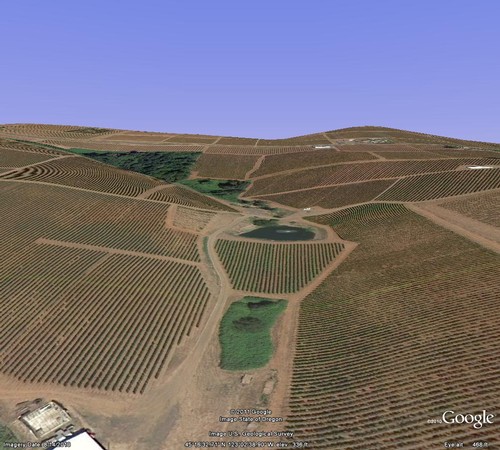
Mesoclimate is described as the climate of a site as influenced by elevation, aspect, slope or distances from large bodies of water. Its scale extends from tens of yards to miles depending on the consistency in topography. Mesoclimate is often referred to as Topoclimate for it’s the topographic influence on a site’s climate (figure 2).
Figure 2.
Microclimate
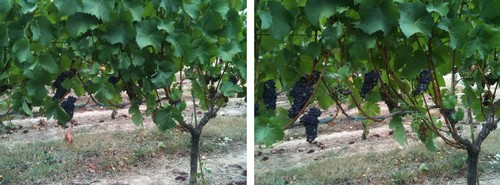
Microclimate is the smallest scale of climate. Its scale is from tens of yards to millimeters. Examples include conditions behind windbreaks, near trees (figure 3), around the vine canopy and inside the canopy. Humans manipulate vine canopy microclimate with trellis systems, shoot positioning, leaf and lateral removal (figure 4). Manipulating canopy microclimate alters disease pressure, fruit composition and fruitfulness of shoots.
Figure 3.
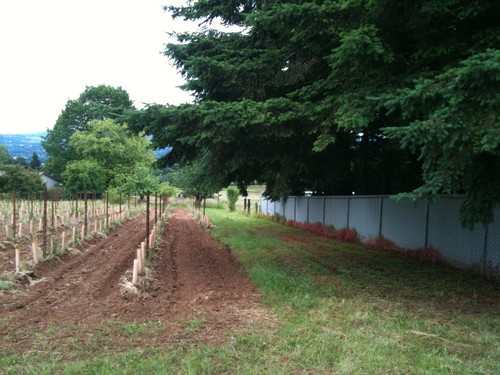
Figure 4.